Blog
 In our last two articles, we looked at some evidences for a young earth and universe. So what evidence has many scientists convinced that the universe and earth are millions or billions of years old? In the next two articles in this series,we will look at two supposedly foolproof evidences, ice core dating and distant starlight.
We have already looked at the principal evidence used for an old earth, radiometric dating, and have seen that it has many assumptions built into it, and there are problems with concluding that it proves an old earth. See article in part 2 of this series:
Creation-Could it have only taken six days?
But there are other evidences cited as well, such as the age of ice cores that supposedly prove the existence of ancient “ice ages”.
However, just as we saw that there are different ways of interpreting the radiometric data, there are also different results on can get from the ice core data, depending on your starting assumptions.
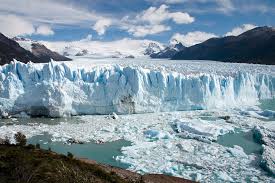
Ice cores are sections of ice that have been drilled out of Antarctic and Greenland ice, that represent snowfall that has turned to ice. By counting the bands or layers, and assuming that those bands are annual layers, great ages, in the hundreds of thousands, or millions of years, are deduced from the data. The question is, are these really annual layers, especially in the deeper parts of the ice core?
One of the methods used to identify supposed annual layers is the Oxygen Isotope Ratio method. Marine organisms such as Foraminifera take in oxygen when they build their shells that are made out of calcium carbonate (CaCO3). These shells become ocean bottom sediment when these creatures die, and two isotopes of oxygen that are incorporated into these shells , the O18 to O16 ratio, can be measured from shell remains at different levels withing the sea sediment. These two isotopes of Oxygen, O 18 and O 16 , are compared and the ratio determined. During a warmer period, the ratio of O18 to O16 is higher, and it is lower during a cooler period. The seasonal difference is interpreted as an annual change. However, there are serious difficulties with using these isotope ratios to determine past climate changes, because there are many other variables that affect this ratio besides the general overall climate, such as local short-term variations in temperature and ice volume. Also, this method of detecting annual layers does not work well or at all in the deeper parts of the cores.
But it is assumed that the ice sheet is millions of years old, and that the sheet has stayed at about the same height and shape for a few million years. So they believe that each annual layer has been compressed deeper and deeper into the ice sheet, until the layers are very compressed and thin, yet they are still counted as annual layers. So the large number of annual layers is a product of the assumed long time period. What makes this an even more difficult problem is that at greater depths in the ice core, the layering become less distinct and methods other than straightforward visual counting must be used (see article by physicist Dr. Jake Hebert: Ice Cores, Seafloor Sediments, and the Age of the Earth (part 1)). These other methods such as looking for dusty bands and changes in electrical conductivity of the ice have similar problems as well, getting worse with depth (Ice Cores, Sea Floor Sediments, and the Age of the Earth ( part 2))
But if the ice sheet is assumed to be younger, that is, 4,000 to 5,000 years old according to the theory of a post-flood Ice Age, then the compression of the ice would be much less, and one annual layer deep down may have been interpreted as 100 or 1,000 annual cycles. But they may in fact only represent storm cycles and other variations within a single year.
Atmospheric scientist Michael J. Oard comments on this in his article :Do Greenland ice cores show over one hundred thousand years of annual layers?:
 “From their flow models, uniformitarian scientists estimate the anticipated thickness of each annual layer from the top of the ice to near the bottom. At the top, the annual layers represent about 800 mm of compacted snow, which will compress into 240 mm of ice.8 These annual layers show up quite well near the top of the ice core. Uniformitarians and creationists agree that these measurements represent annual layers. However, after compression, the annual layer thickness of each model, shown in Figure 3, soon diverges significantly, and the agreement ends. For example, 2,000 m down the GISP2 Greenland ice core, the assumed annual layer thickness from the uniformitarian model would be about 20 mm,9 whereas the creationist estimate would be around 2,000 mm, 100 times more. The assumed thickness of the annual layers is important because it determines how many measurements of each variable are made down the length of the core. Based on their expected annual thickness, uniformitarian scientists take enough measurements to resolve what they believe are annual cycles.”
So we can see that the age estimates depend on the starting assumptions of the model one is using.
Oard goes on in this article to show how changes and oscillations in the variables used in the conventional model to determine annual layers, could in fact be produced in a single year: “
In the creationist model, the oscillations in the variables used by uniformitarians to determine annual layers could have been produced within a single year. Indeed, uniformitarians understand that very short-term oscillations, representing as little as a day or two, show up in the variables.12 For example, a storm has a warm and cold sector that produces significant fluctuation in each of the variables and these storm oscillations may be on the order of several days. Even uniformitarians recognise that these storms can produce problems for counting annual layers, as Alley et al. state:
‘Fundamentally, in counting any annual marker, we must ask whether it is absolutely unequivocal, or whether nonannual events could mimic or obscure a year. For the visible strata (and, we believe, for any other annual indicator at accumulation rates representative of central Greenland), it is almost certain that variability exists at the subseasonal or storm level, at the annual level, and for various longer periodicities (2-year, sunspot, etc.). We certainly must entertain the possibility of misidentifying the deposit of a large storm or a snow dune as an entire year or missing a weak indication of a summer and thus picking a 2-year interval as 1 year. (Alley et al. Visual-stratigraphic dating of the GISP2 ice core: basis, reproducibility, and application, J. Geophysical Research 102 (c12):26367–26381, 1997.)
For more on the post flood theory of the Ice age, and ice core dating, a good reference is An Ice Age Caused by the Genesis Flood, Michael J. Oard, Institute for Creation Research, El Cajon, Ca, 1990. Also see The Frozen Record by Michael J. Oard, June 2005, Institute for Creation Research, El Cajon, CA. In these books Oard covers the evidence that there was just one ice age, and it was not as long ago as in the conventional view.
More articles showing this evidence are:
Astronomical troubles for the Astronomical Hypothesis of the Ice ages
An article showing the circularity of using Deep sea floor sediments dating and ice cores, by Dr. Jake Hebert, a physicist, can be found here:Circular Reasoning in the Dating of Deep Seafloor Sediments and Ice Cores: The Orbital Tuning Method
Other articles on the ice age and ice core dating:
Are the Greenland & Antarctic Ice Sheets Old?
Ice Cores, Seafloor Sediments, and the Age of the Earth (part 3)
Greenland Ice Cores: implicit evidence for catastrophic deposition
For other old earth evidences involving layers of rocks and various geological features, see my upcoming series of articles on Noah’s Flood.
In the final article in this series, we will look at the issue of distant starlight and the age of the universe.
![]()
![]()
![]()
![]()